
How innovative are transition countries?
BEEPS V provides a valuable snapshot of firm-level innovation in the transition region today. To get a deeper sense of how innovation in economies of the region has evolved over time, this chapter now turns to country-level measures of innovation outputs, which are similar to the country-level measures of innovation inputs that were discussed above.
Patent quality
A common country-level measure of innovation at the technological frontier is the number of patents that are held by firms or individuals from a given country. While this has the advantage of comparability (as data are available for a large number of countries), it is a narrow measure which captures a limited range of innovations. Not all innovations are patented, and the likelihood of firms or individuals applying for a patent in a given economy will depend on the legal system, local practices and the sectors in which that economy specialises.12 The extent to which patents are converted into commercialised innovations will also vary considerably from country to country.
With these caveats in mind, Chart 1.13 shows that there is a positive relationship between R&D expenditure and the number of patents held. However, while this relationship is strong in advanced markets, it is weaker in emerging markets, where levels of R&D spending and patenting are generally lower.13 A number of countries (including Belarus and Kazakhstan) have more patents than their R&D expenditure would predict, while other countries (including SEMED countries and Turkey) have relatively few patents.
Importantly, not all patents are of equal value: some may represent small modifications to existing products (incremental innovation), whereas others may cover breakthrough technologies such as lasers (radical innovation). One way to distinguish between patents of differing quality is to look at patent citations, as important patents tend to be cited in subsequent patent applications. Citation data suggest that patents in the transition region tend to be of lower quality than those found in more developed economies: only 6 per cent of patents in transition countries are cited at least once, compared with 44 per cent of patents in the United States (see Chart 1.14).
Furthermore, the percentage of patents that are held by firms is much lower in the transition region than it is in the United States. In the United States only 6 per cent of patents are held by universities or public organisations, compared with 11 per cent in the transition region (see Chart 1.15).14 In fact, in Russia, Poland and Ukraine over a third of all patents are held by universities or research institutes. This reflects the persistent legacy of centralised state-led research. If academic and public institutions have only weak links with industry, and universities and research institutes have limited incentives to commercialise their inventions, the patents they hold may raise the profile of their institutions but contribute little to innovation or productivity growth in the economy.
CHART 1.13
CHART 1.14
CHART 1.15
- Transition countries
- All other countries
Source: UNESCO and WIPO.
Note: Data represent averages over the period 1996-2011.
Source: PATSTAT and authors’ calculations.
Note: This chart shows the percentage of patents that are cited in at least one other patent application.
It is based on data for the period 1999-2011.
Source: PATSTAT and authors’ calculations.
Note: Based on data for the period 1999-2011. Patents are classified on the basis of the methodology developed by the Katholieke Universiteit Leuven. See European Commission (2011) for more details.
Adoption of existing technology
Measures of innovation output such as patents do not take full account of the adoption of existing technology. Ideally, one would like to have a broader measure of how innovative countries are. This measure would not only include information on innovation at the technological frontier (in other words, information derived from patents), but also cover the sophistication of each country’s output (for instance, by accounting for countries’ export mixes).15
In order to develop such a measure of country-level innovation, the first step is to ascertain the innovation content of various industries. We can then assess the export mixes of individual countries on the basis of the innovation content of these exporting industries.
Read more
This kind of comprehensive measure is attractive because it looks at what countries produce competitively, rather than simply looking at what they patent. It also provides valuable insight, as a more sophisticated export structure is associated with better long-term growth prospects, as discussed in the Transition Report 2008.16 (Furthermore, the analysis in Chapter 2 shows that exports of innovation-intensive industries grow faster in countries with a favourable business environment.)
In this first step, the intrinsic innovation intensity of various industries is measured using data on the number of patents granted per worker in these industries in the United States. While the figures are not a perfect reflection of the degree of innovation in the various industries (as incentives to submit patent applications may vary across industries), they do, on balance, provide a reasonable approximation of the role played by innovation in the various sectors and are based on observable data.
On average, firms in industries that patent more tend to introduce new products more frequently (as can be seen from the BEEPS data), and the lifespan of these products tends to be shorter, prompting firms to innovate continuously. The United States is used as a reference point because it is a highly diversified economy, the world’s largest consumer market (resulting in strong incentives to patent) and a world leader in R&D. This means that it is easier for an industry to fully realise its innovation potential in the United States.
Since the innovation intensity of all industries is measured using US data, these estimates are not affected by differences between the legal systems and business cultures of individual countries. Consequently, if one country has a lower patent output than another for a given industry, this will reflect a combination of lower incentives to patent and a less supportive innovation environment.
Unsurprisingly, computing equipment, communications equipment, chemicals and pharmaceuticals are among the most innovation-intensive industries, while textiles, food and beverages, and wood processing are among the least innovation-intensive (see Chart 1.16).
This measure is based on the innovation potential of the various industries, rather than the innovation realised in these industries in the various countries. Indeed, while emerging market firms operating in innovation-intensive industries will not necessarily be directly involved in innovation at the technological frontier, the nature of these industries suggests that such emerging market exporters will tend to roll out new products more often.
For instance, Box 3.1 in Chapter 3 shows that, by participating in global value chains in such industries, firms tend to develop skills and expertise and that, over time, this enables them to move up the value-added chain17 and produce original innovation. The manufacturing of telecommunications equipment in China is one example of how this transformation may occur. While foreign direct investment has played a key role in the development of this sector in China, local firm Huawei has gradually become a major international player and a world leader in this industry. Likewise, new or modernised industries tend to foster the development of local supply chains. For instance, top-tier suppliers of automotive parts in emerging markets can achieve quality that is close to international best practices.18
We can now calculate the innovation intensity of a country’s exports by producing a weighted average of the innovation intensity of its exported goods.19 If we look at the innovation intensity of world exports as a whole, we can see that major contributions are made not only by the sectors with the greatest innovation intensity, but also by key manufacturing sectors such as machinery and motor vehicles (see Chart 1.17).
Thus, a high degree of innovation intensity in a country’s exports reflects not only comparative advantages in high-tech sectors such as computing equipment, but also strong positions in sectors with moderate innovation intensity that account for a large percentage of international trade. The innovation intensity of an economy’s exports is expressed as a percentage of the average innovation intensity of global exports as a whole. Therefore, an innovation intensity score of more than 100 means that the innovation intensity of a country’s exports is above the global average.
Looking at exports, rather than the total output of a particular industry, has the advantage of picking out goods that are competitive in international markets and thus more likely to be closer to the technological frontier. However, an analysis of exports also has its limitations. In particular, comprehensive data on the structure of exports are available only for goods. Thus, service sectors (such as call centres or IT consulting) are not covered, and services are becoming increasingly innovation-intensive.
CHART 1.16
CHART 1.17
Source: USPTO.
Note: This chart is based on averages for the period 2004-08 and uses a logarithmic scale.
Figures correspond to the number of patents granted per 1,000 workers in the United States.
Source: USPTO, UN Comtrade, Feenstra et al. (2005) and authors’ calculations.
Note: Based on 2012 trade flow data. Contributions are calculated as the product of industries’ innovation intensities and their shares in world trade, before being normalised so that they total 100 per cent.
Changes in the innovation intensity of countries’ exports
How has the innovation intensity of exports evolved over time? Globally, innovation activity has increasingly shifted from advanced economies to emerging markets. The last few decades have seen a major shift in the production of innovative goods, with a growing role for foreign direct investment and the rapid globalisation of production chains. In addition, emerging markets now account for an increasing share of both global R&D spending and R&D output.20
These broader trends are reflected in the innovation intensity of the various regions’ exports (see Chart 1.18). In line with these developments, the innovation intensity of the transition region’s exports has risen over time. Of the various emerging markets, Asia has seen the fastest growth in innovation intensity, while overall growth in the transition region has been similar to that observed in Latin America. Innovation intensity has generally remained low in the Middle East and North Africa.
These overall trends mask substantial heterogeneity at the level of individual countries, in terms of both the level of innovation intensity (see Chart 1.19) and its evolution over time (see Chart 1.20). In central Europe and the Baltic States (CEB) innovation intensity increased rapidly in the 2000s, reaching levels comparable to those seen in OECD countries. This structural change was, to a large extent, facilitated by foreign direct investment on the part of core EU countries and the integration of CEB producers into European value chains. The innovation intensity of exports has also increased moderately in the SEE and SEMED regions. Overall, though, changes outside the CEB region have been modest and levels have remained below 60 per cent of the average innovation intensity of world exports. Israel, the main comparator country in BEEPS V and MENA ES, has highly innovation-intensive exports.
Since the start of the transition process, a number of countries have succeeded in increasing the innovation intensity of their exports and raising income per capita, moving upwards and to the right in Chart 1.21. These include Estonia, Hungary, Latvia, Romania, Slovak Republic and Egypt – although in the case of Egypt, both the innovation intensity of exports and income per capita remain relatively low, highlighting the fact that significant challenges still lie ahead. Notably, there have been no instances where the innovation intensity of exports has improved without commensurate growth in income per capita.
However, a number of other economies have remained “stuck”, with production concentrated in less innovation-intensive industries and modest levels of income per capita. This group of countries includes Moldova, Ukraine and – at a somewhat higher level of innovation intensity – Jordan and Morocco. A number of countries have seen rapid growth in per capita income in the absence of improvements in the innovation intensity of their exports. These include exporters of commodities (such as Azerbaijan and Russia) and a number of other countries (such as Belarus). These countries face the challenge of sustaining growth once commodity prices stop rising and/or higher incomes erode their competitive advantages in their traditional export markets.
CHART 1.18
CHART 1.19
CHART 1.20
CHART 1.21
Source: USPTO, UN Comtrade, Feenstra et al. (2005) and authors’ calculations.
Note: Data represent weighted averages, with the innovation intensity of exports being measured as a percentage of the average innovation intensity of world exports. The MENA region excludes SEMED countries.
Innovation intensity of exports
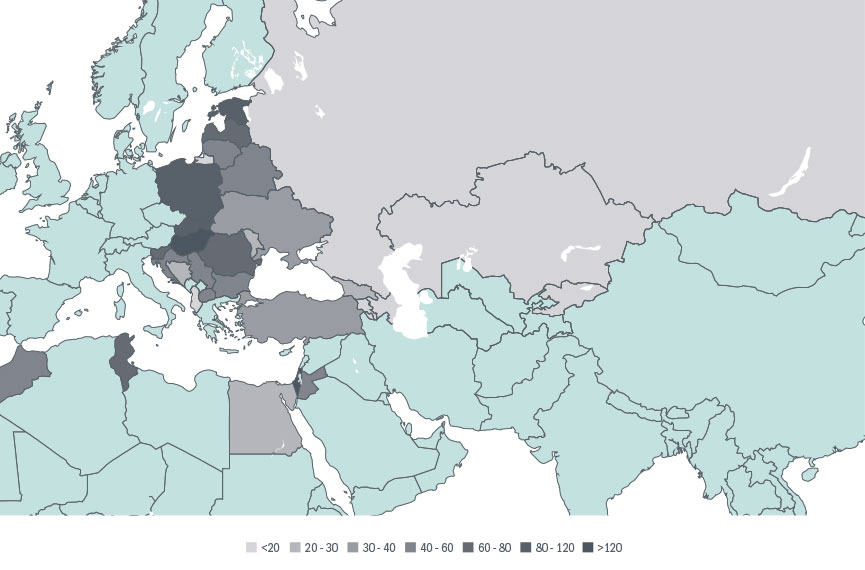
Source: USPTO, UN Comtrade, Feenstra et al. (2005) and authors’ calculations.
Note: Based on data for 2012. The innovation intensity of exports is measured as a percentage of the average innovation intensity of world exports. Darker colours denote higher levels of innovation intensity. Israel is included as a comparator country.
Source: USPTO, UN Comtrade, Feenstra et al. (2005) and authors’ calculations.
Note: Data represent simple averages of the innovation intensity of individual countries’ exports (expressed as a percentage of the average innovation intensity of world exports).
Source: USPTO, UN Comtrade, Feenstra et al. (2005) and authors’ calculations.
Note: Arrows show changes over time for selected countries, indicating the difference between average values in the period 1993-94 and average values in the period 2010-11. GDP per capita is based on 2005 constant prices at purchasing power parity and is expressed as a percentage of average GDP per capita in the EU-15 countries (which is calculated as a simple average).
Innovation intensity of exports and patents
This measure of innovation intensity emphasises the adoption of existing technology, rather than innovation at the technological frontier. This is an important distinction, as in the most innovation-intensive industries the countries that account for the largest shares in the world’s patents may be different from those that account for the largest shares in international trade (see Chart 1.22). In other industries (such as vehicle manufacturing) shares in patents and exports are broadly aligned. Thus, certain countries may be good at adopting technologies without making a major contribution to their development. The innovation intensity of a country’s exports captures this important aspect.
Despite these differences, there is a positive relationship between the innovation intensity of exports and patents (see Chart 1.23). Indeed, many mature economies (including the United States, Israel, Japan and South Korea) tend to be among the strongest performers in terms of both patents and the innovation intensity of exports.
Meanwhile, a number of emerging markets appear to be better at adopting existing technologies, which is reflected in a high innovation intensity for exports but lower patent output. One notable example here is China. A similar pattern can be observed in the Czech Republic and a number of CEB economies (including Hungary and the Slovak Republic).
Conversely, Belarus, Russia, Kazakhstan and Ukraine have a relatively high incidence of patents, but appear to be less successful at commercialising the underlying inventions and adopting existing technologies. This may also be due to the fact that in some of these countries a large percentage of patents are held by universities and research institutes (see Chart 1.15), which have fewer incentives to commercialise their inventions.
CHART 1.22a
CHART 1.22b
CHART 1.23
Source: USPTO, UN Comtrade and authors’ calculations.
Note: Based on data for 2012. Figures denote the various countries’ shares in total patents and exports in the two sectors in question (expressed as percentages).
Source: USPTO, UN Comtrade and authors’ calculations.
Note: Based on data for 2012. Figures denote the various countries’ shares in total patents and exports in the two sectors in question (expressed as percentages).
- Transition countries
- All other countries
Source: USPTO, UN Comtrade, Feenstra et al. (2005), WIPO, Penn World Tables and authors’ calculations.
Note: Based on averages for the period 1996-2011. The innovation intensity of a country’s exports is measured as a percentage of the average innovation intensity of world exports.