TRANSITION REPORT 2014 Innovation in Transition
TRANSITION REPORT 2014 Innovation in Transition


Ralph De Haas is a Deputy Director of Research at the EBRD. Prior to joining the EBRD, Ralph worked at the Banking Supervision and Monetary Policy Departments of the Dutch central bank. He holds a PhD in Economics from Utrecht University and is currently a part-time Associate Professor of Finance at Tilburg University. His main research interests include international banking and financial integration, development economics, and small-business finance.
Governments everywhere acknowledge the importance of innovation for long-term growth. This is most noticeable in countries where the easy options have been exhausted and future growth depends on more efficient ways of combining inputs or producing new or improved outputs.
Furthermore, the creation and spread of new knowledge are associated with significant market failures. For example, an individual firm deciding whether to invest in research and development (R&D) may fail to take account of the potential for positive spillovers to occur as the knowledge created becomes available to the wider economy. Such externalities call for government action.
Governments can support innovation directly, either by funding public research or by encouraging private investment in research and innovation (for example through support for the transfer and spread of technology, support for venture capital, seed capital and R&D, and innovation-related tax incentives or incentives fostering cooperation between industry and science). They can also foster innovation indirectly, by providing a suitable environment for firms that are willing to invest and innovate.
The policy mix should take account of potential externalities stemming from innovation by individual firms, as well as the degree of competition within the relevant sector. Most policy options will favour one sector over another, and some sectors may require specific interventions. This may force governments to make difficult choices, striking a balance between direct support for innovation and improvements in the general environment.
The combination of policy objectives and instruments should be tailored to a country’s level of development and the strengths and weaknesses of its innovation system, so it should vary both across countries and over time. Although some countries in the EBRD region have made important technological breakthroughs in the past – such as Sputnik 1, the first artificial satellite to orbit the Earth, and Vostok 1, the world’s first manned spacecraft – they are not currently operating at the technological frontier in most areas.
Instead, they are at various stages of the catching-up process. Furthermore, the legacy of centrally planned innovation systems still looms large over much of the EBRD region – particularly in the countries of the former Soviet Union, where most research work was conducted by special research institutes, rather than universities or private companies.1 Although the pure science and innovation that resulted from these top-down systems was sometimes very advanced, it often failed to translate into commercially viable applications, as links with industry were weak. While there are examples of innovative companies subsequently emerging from these environments, the interface between research and the rest of the economy remains rudimentary at best.
With this in mind, this chapter provides an overview of science, technology and innovation policies (henceforth simply referred to as “innovation policies”) in transition countries and assesses their appropriateness given the level of development in these countries. It first analyses the potential for transition countries to follow a knowledge-based growth path, given their current position in terms of innovation. It then discusses the main characteristics of the innovation policies currently being pursued, before looking at whether such policies are in line with these countries’ levels of development and their potential for knowledge-based growth. It concludes by providing guidelines for more differentiated and more appropriate innovation policies in individual countries in the region.
Transition countries differ significantly in terms of their rates of innovation and the ways in which firms acquire or create the know-how that they need. The analysis in Chapter 3 demonstrates that both firm-specific factors (such as a firm’s age, size and ownership) and country-specific factors (such as the business environment) influence innovation. The importance of these factors varies depending on a country’s position relative to the global technological frontier – in other words, whether a country is in a pre-catching-up phase, a catching-up phase or a post-catching-up phase.2
The way in which firms acquire the knowledge that underpins innovation tends to differ across these stages of development. As Chapter 1 shows, countries can be grouped together in four broad categories in terms of the main ways in which knowledge is obtained: (i) “low innovation” countries (where few companies spend money on buying or producing knowledge); (ii) “buy” countries (where firms predominantly buy technology, and relatively few firms engage in in-house R&D); (iii) “make and buy” countries (where firms are more active in terms of in-house R&D, relative to the purchasing or licensing of patents and know-how); and (iv) “make” countries (where firms are even more active in terms of in-house R&D).
In general, analysis suggests that in countries with very low levels of development (in other words, countries in the pre-catching-up phase) the take-up of new technology is often still slow (or absent entirely). This is partly because insufficient human capital severely constrains technological progress. As economies develop and move into the catching-up phase, the pace of such take-up starts to vary greatly, even across countries that are at similar levels of development.3 One explanation for this heterogeneity in take-up rates is differences in countries’ access to (typically foreign) technology, particularly information and communication technology (ICT).
The openness of a country’s economy to foreign direct investment (FDI) and other forms of international cooperation are the key channels that determine the extent to which a country that is catching up with the technological frontier is able to tap the global pool of existing technologies.4 In particular, attracting FDI helps countries to effectively absorb such technologies. For instance, the Spanish-based firm Grupo Industrial Roquet is investing, in cooperation with the EBRD, in the production of standard hydraulic cylinders for agricultural and construction machinery in Romania. The use of modern technology – particularly as regards welding techniques and other modern production facilities – was essential to obtaining the approval of major international clients such as Kubota, Caterpillar and John Deere.
This absorptive capacity also depends on many other factors. Among these are: (i) the availability of technologically literate workers (reflecting both the quality of education and the effectiveness of on-the-job training programmes); (ii) good management skills; (iii) incentives for firms to use higher-technology processes; (iv) access to capital; and (v) the existence of adequate public-sector institutions which will support the take-up of critical technologies where market forces prove to be insufficient.5
As countries develop further and move closer to the technological frontier, another factor explaining the heterogeneity of the take-up of technology comes into play. This factor is the capacity of countries to create their own knowledge as they move from the “buy” group to the “make and buy” group.6 The adoption of technology and its modification to suit local circumstances tend to be more effective when domestic firms have R&D programmes.
At higher levels of development (as countries move to the “make” group), a country’s own R&D can increasingly start to generate new processes and products, particularly in areas where the country has developed advanced capabilities. In this post-catching-up phase, countries require cutting edge know-how, supported by both public and private R&D and good links between the two. Incentives for investment in R&D and innovation, which should already have been put in place, now become crucial. This requires access to markets where there is strong demand for new products, as well as effective intellectual property rights, tailored finance and access to specific skills.
These prerequisites for knowledge-based growth can be grouped together under broader business environment conditions (or framework conditions). Such conditions affect the operations and decisions of all firms in the economy, particularly firms that innovate. Some conditions affect specific aspects of firms’ capacity to innovate. Business environment conditions include the quality of institutions (in other words, the legal and administrative framework that underpins interaction between individuals, firms and governments), macroeconomic stability and the functioning of product, labour and financial markets. (The importance of these factors as drivers of innovation is discussed in Chapter 3.)
Taking into account differences in levels of development, the conditions influencing innovative capacity can be divided into those affecting access to foreign technology, those affecting firms’ capacity to adopt and fully understand existing technologies, and those affecting the ability to create knowledge.7
For instance, access to technology depends on a country’s economic openness, the availability and use of ICT infrastructure and the extent to which FDI facilitates the transfer of technology. Absorptive capacity is underpinned by the quality of secondary and undergraduate education, the effectiveness of on-the-job training and the extent of any “brain drain”. Creative capacity depends crucially on: (i) the quality of postgraduate education; (ii) the availability of highly qualified scientists and engineers; (iii) flexible product and labour markets; (iv) the quality of scientific research institutions; (v) effective cooperation between science and industry in the field of research; (vi) the protection of intellectual property; and (vii) the availability of venture capital.
Thus, as countries develop, the relevant conditions need to evolve in order to support knowledge-based growth. Having better access to technology without an educated workforce that is capable of effectively absorbing such technology will make it difficult for countries to progress to the “buy” stage of knowledge acquisition. Countries that become successful at absorbing technology and seek to create knowledge will need to improve the availability of specific skills. They will also need to strengthen links between public scientific institutions and the private sector.8
Policies that help to improve these conditions must evolve accordingly, depending on the extent to which conditions supporting knowledge-based growth are already in place. Where countries are still in the early stages of technological development, policies should focus on fulfilling the conditions for access to and absorption of technology.
In these circumstances, a policy mix that focuses solely on strengthening creative capacity (for instance, through increases in venture capital or grants fostering cooperation between industry and science) may yield only limited results. At the same time, these factors cannot be completely ignored, as elements such as cooperation between industry and science and the quality of scientific research institutions take a long time to improve.
A simple framework comprising six sets of conditions for knowledge-based growth (the quality of institutions, the macroeconomic environment, the functioning of markets, access to technology, absorptive capacity and creative capacity) is used below to provide a brief assessment of the conditions for innovation in individual countries in the transition region.
Assessment in these areas is based on the relevant global competitiveness indicators. Data on these indicators are provided not only for the transition countries, but also for a number of advanced economies (in other words, countries operating at the technological frontier) and emerging market comparators.9 The scores reflect the establishment of various regulations (such as laws protecting intellectual property or requirements that need to be fulfilled in order to start a new company) and their implementation, as well as expert assessments of the quality of economic institutions and firms’ capacity to access and absorb technology.
The largest gap between the transition countries and the advanced economies relates to the capacity to create knowledge (see Chart 5.1a). While transition countries score relatively well on the availability of scientists and engineers (thanks to the emphasis placed on science and technology in the days of centrally planned economies), they lag behind when it comes to the quality of scientific research institutions and the availability of venture capital.
The gap between transition and advanced economies in terms of their absorptive capacity and access to technology is smaller, but still substantial, driven primarily by the lower availability and use of ICT in transition countries. This is also the area where differences within the transition region are the largest. This suggests that countries in the region tend not to fully exploit the potential of ICT when fostering innovation-based growth. A lower use of ICT often reflects insufficiently dynamic product and labour markets, as well as inadequate university systems.10
Transition countries perform somewhat better when it comes to broad business environment conditions such as the functioning of markets, although the gap in terms of the quality of institutions is sizeable.
Differences relative to other emerging markets (such as Brazil, Chile, China, India and South Africa) are smaller (see Chart 5.1b). However, the transition region is not in the lead on any aspect. Indeed, it trails all of those comparators when it comes to the capacity to create knowledge (where Chile scores highest).
Within the transition region, countries differ substantially in terms of the conditions for innovation. As expected, countries in the “make and buy” group tend to score higher than the “buy” and “low innovation” countries on all aspects (see Chart 5.2). In turn, the “buy” countries score higher than the “low innovation” countries on all aspects (with the exception of the quality of institutions, where differences are generally smaller).
These broad trends mask substantial heterogeneity within each group. For instance, Hungary, Poland and Turkey score highest among the countries in the “buy” group, signalling greater potential for knowledge-based growth. However, all of these countries have areas where they underperform. Hungary scores relatively poorly on the quality of institutions. Poland does badly on education and Turkey underperforms when it comes to labour market efficiency and the use of ICT.
Countries in the “low innovation” category have made substantial improvements since 2007, particularly in terms of the quality of institutions, access to technology and absorptive capacity. In these areas they have closed all or most of the gap relative to countries in the “buy” category. However, they continue to be held back by insufficient competition in their product markets, as well as their relatively inefficient labour and financial markets.
Regardless of these differences, the fact that countries that are more highly developed score better on all conditions for innovation suggests that they need to be looked at as a whole. Estonia, the transition country with the highest score in terms of the conditions for innovation, illustrates the importance of such a systemic approach to innovation (see Box 5.1).
Source: World Economic Forum (2013) and authors’ calculations.
Note: The scores for each indicator range from 1 to 7, where 1 corresponds to the worst possible outcome and 7 corresponds to the best possible outcome. Scores for “macroeconomic stability” are not shown, given the extraordinary circumstances affecting this broad framework condition in the review period. Data are not available for Belarus, Kosovo, Tajikistan, Turkmenistan or Uzbekistan. Figures for the transition region are unweighted cross-country averages.
Source: World Economic Forum (2013) and authors’ calculations.
Note: Transition countries are grouped together on the basis of the methodology presented in Chapter 1. (See Chapter 1 for a list of the countries in each category.) The scores for each indicator range from 1 to 7, where 1 corresponds to the worst possible outcome and 7 corresponds to the best possible outcome. Scores for “macroeconomic stability” are not shown, given the extraordinary circumstances affecting this broad framework condition in the review period. Data are not available for Belarus, Kosovo, Tajikistan, Turkmenistan or Uzbekistan. Figures are unweighted cross-country averages.
Innovation policies can play a crucial role in improving the conditions for innovation, identifying and addressing bottlenecks that impair the ability of countries to innovate and improve productivity.
In fact, as of 2014 all countries in the EBRD region have drafted a nationwide policy or strategy with a view to providing public support for innovation activities. Most countries established the bulk of their policy frameworks during the 2000s. Some countries (such as Tajikistan and Turkmenistan) did not start outlining their priorities until more recently. This section examines these policies, looking at the extent to which they reflect countries’ potential for knowledge-based growth as assessed in the previous section.
In order to obtain detailed information about innovation policies in transition countries, the government bodies in charge of innovation policy in all countries where the EBRD works were asked to complete a questionnaire in summer 2014.
A total of 19 countries responded in time to be included in this analysis. The response rate was relatively high among countries at the “make and buy” stage (with Bulgaria, Croatia, Kosovo, Latvia, Lithuania, Romania, Slovak Republic and Slovenia all replying). A similarly high response rate was seen among those at the “buy” stage (with Bosnia and Herzegovina, Cyprus, Hungary, the Kyrgyz Republic, Moldova, Poland, Serbia, Tunisia and Ukraine responding as well). Meanwhile, in the “low innovation” category only two countries responded (Albania and Armenia).11 The survey evidence was supplemented with information from publicly available sources.
The survey results suggest that there is remarkably little variation across transition countries in terms of the objectives of innovation policy (see Chart 5.3). Virtually all countries regarded the objectives of enhancing the contribution that public research organisations make to the country’s innovation performance and improving the business environment for innovative firms as either “important” or “highly important”. All of them also placed considerable emphasis on better links between science and industry. Such links included improved commercialisation of academic research.
In contrast, while the objective of producing educated and trained personnel – a critical factor underpinning a country’s capacity to efficiently adapt and use new technologies – was considered important, it tended to score less than the top priorities referred to above. Furthermore, some countries at the “buy” stage ranked it lower than countries in the “make and buy” category. This was surprising, given that “buy” countries would be expected to place greater emphasis on factors facilitating the absorption of technology.12
Source: EBRD innovation policy questionnaire and authors’ calculations.
Note: This chart ranks the strategic objectives of innovation policy in descending order according to the percentage of countries that regard them as “highly important” or “important”.
The consensus among the transition countries extends to the preferred policy instruments for supporting innovation. The three instruments most frequently regarded as “important” or “highly important” are (i) competitive funding of R&D, (ii) support for the transfer of technology and (iii) incentives for cooperation between industry and science (see Chart 5.4).
At first glance, this support for the transfer of technology appears to be well suited to the needs of emerging market economies, where the adoption of existing technology plays a prominent role. On closer inspection, however, we can see that policies primarily target the transfer of technology from science to industry. Virtually all countries (with the exception of Bulgaria) report that they have government initiatives in place aimed at helping to translate research in universities and public research organisations into innovation, together with initiatives strengthening research in these institutes.
At the same time, initiatives supporting firms’ absorption of technology (the spread of technology and technology matching services13) are, on average, deemed only “somewhat important”. What is more, the actual initiatives often focus on the transfer of technology from science to industry (see Box 5.2). While public research institutes are encouraged to develop applied technologies, incentives for firms to take on and commercialise these technologies often remain weak. This potentially undermines the effectiveness of technology transfer policies. (See Box 5.3 for a more detailed assessment of the links between industry and science in transition countries.)
Almost all countries also report support for small and medium-sized enterprises (SMEs) and start-ups – mostly in the form of project-based financial support, incubators, and science and technology parks. Such location-based innovation policies – specific measures directed at well-defined geographical areas – are in place in virtually all transition countries. These policies provide for the direct financing of economic activities or establish special regulations governing targeted areas. They also aim to promote a culture of competitiveness and innovation among the firms located there and seek to stimulate technological spillovers. (See Box 5.4 for further discussion of location-based policies.)
Support for venture and seed capital is more prominent in the more advanced transition economies (although even there it remains relatively modest, as discussed in Box 4.1).
Source: EBRD innovation policy questionnaire and authors’ calculations.
Note: This chart ranks economic and financial instruments of innovation policy in descending order according to the percentage of countries that regard them as “highly important” or “important”.
Overall, policy priorities and instruments look remarkably similar across the entire transition region, despite fairly large differences in terms of the level of development and the potential for knowledge-based growth. This suggests that the stated policy targets and instrument mixes are, in most cases, insufficiently tailored to the specific circumstances of countries, with policy choices seemingly following the fashion of the day.
Analysis suggests that, with some exceptions, transition economies tend to follow the type of innovation policy that is typically used by advanced economies. They do not necessarily identify priority areas on the basis of careful analysis of their current strengths and comparative advantages.14
The overarching focus on the development of high-tech industries and the omnipresent objective of improving the contribution that public research organisations make to the country’s innovation performance are perhaps the clearest illustration of this.
This kind of “one size fits all” approach may not suit many of the transition countries. Given the current prerequisites for knowledge-based growth in these countries, governments need to focus more on supporting the absorption and adaptation of existing cutting-edge technology, which features far less prominently as a priority. Similarly, greater attention needs to be paid to improving the formation of human capital in universities, which may often focus excessively on academic patenting. In extreme cases, simply taking innovation policies that are designed for advanced economies and transposing them to transition countries may be more of a deterrent, rather than acting as a catalyst for knowledge-based growth.
One area where innovation systems could usefully imitate advanced economies is policy design and governance.
Effective innovation policies rely on the careful identification of key bottlenecks preventing innovation. This is important, because policies need to evolve as a country’s innovation develops. Continued monitoring of a country’s performance in terms of framework conditions can guide the design, evaluation and adaptation of its innovation policy mix.
Identifying bottlenecks requires close communication with the intended recipients of innovation support. It also calls for regular evaluation of the outcomes of policies and an ability to learn from past mistakes.15 The use and effectiveness of programmes targeting innovation should not only be monitored, but also benchmarked and evaluated. Future policy design phases should use the results of such evaluation exercises.16 Most countries that responded to the EBRD’s innovation policy questionnaire indicated that they assess the effectiveness of spending on innovation support. However, closer inspection of published evaluation exercises suggests that such appraisals are rarely rigorous – even in advanced economies.
Furthermore, three-quarters of respondents reported that they always or usually use the continuation of existing schemes as a selection criterion when choosing instruments. There may be good reasons for this. Continuity of innovation policies increases the private sector’s willingness to undertake risky investments with a long payback period. In addition, the results of innovation policies that depend on such investments may take a long time to materialise. At the same time, continuity needs to be weighed against the need to evaluate policies, learn from past mistakes and redesign policies as the economy evolves.
Finland’s centres of excellence (CoEs) in the field of research are a good example of best practice in terms of governance. This government programme was launched in 1994 for a fixed term of six years and has since been repeated a number of times. CoEs consist of a number of cutting-edge research teams working closely together. The Academy of Finland, which allocates funding to CoEs, establishes priorities in terms of the subject areas to be covered and sets quantifiable targets to be reached by the end of the six-year term, as well as specific short-term objectives. CoEs receive funding in two instalments – one at the beginning of the six-year term and one at the mid-point. The programme is managed by sub-regional councils, which act as an interface with the private sector and various levels of government. A CoE can apply to participate in a new programme at the end of its term, but whether or not its application is successful is determined by the quality of its scientific research plan.17
The effectiveness of innovation policies also depends on the overall quality of governance in the countries that implement them. In this regard, only five survey respondents reported that they never use ad hoc selection criteria or take account of the lobbying activities of particular groups. Weak governance may be particularly damaging when it comes to identifying priority sectors and the allocation of related subsidies and concessions. In general, governments tend not to be particularly good at picking winners, and identifying losers has proven politically difficult. Authorities in countries with weak governance are likely to have particularly poor track records in these areas.
Vertical innovation policies require high standards of governance to be effective, so they may not suit many of the transition economies. Broader sectoral coverage may be particularly advantageous for countries in the early stages of development. Their existing innovation capacity in any specific field is typically too weak to warrant a clear focus based on indigenous strengths. In contrast, broader support for multiple sectors may help to strengthen the general innovation capacity of countries, with strong competitive positions in specific areas being developed over time.
At the same time, the economies in the region have a long history of attempting policies aimed at specific sectors or technologies. While most of these countries do not focus their public support on a single sector, they do tend to identify a few priority areas. As with other features of innovation policy in the region, countries tend to focus on similar priority areas (see Chart 5.5). They show little variation based on their individual circumstances, the existing structure of production or their skills mix.
All transition countries regard ICT, energy, biosciences and biotechnology as “highly important” or “important” priority areas for public innovation spending. Other sectors that are at least “somewhat important” in all countries are the environment, food, digital services and healthcare. There are also a few country-specific priorities. For instance, Kazakhstan, Turkmenistan and Ukraine pay special attention to the energy sector. Belarus and Kazakhstan place emphasis on heavy industries, building on their legacy from the Soviet era. The ICT sector, which is prioritised virtually across the board, is a particularly strong focus for at least three countries – Armenia, Azerbaijan and Egypt – with several dedicated initiatives and programmes (see Box 5.5).
Where countries decide to make active use of vertical policies providing benefits and subsidies to specific sectors or firms, a number of safeguards could help to minimise the risks associated with such policies and increase their effectiveness.
First, in order to minimise rent-seeking behaviour by firms and officials, vertical targeting of particular sectors or firms needs to be based on strict eligibility criteria.18 These criteria include the potential benefits for the broader economy and the degree of competition within the sector.
In this respect, reporting details of activities and spending carried out under innovation support programmes (as well as the beneficiaries of such initiatives) may help to strengthen the governance of these programmes. In EU member states, support for innovation generally constitutes state aid and falls under the corresponding rules governing monitoring and reporting.
Second, vertical policies need to be complemented by horizontal measures. Such measures will create better conditions for productivity growth across all sectors, for instance by improving the business environment, increasing the efficiency of product and labour markets and investing in education and professional training. Effective horizontal policies which address bottlenecks affecting innovation (such as corruption, inadequate skills among the workforce, and customs and trade regulations) help firms in all sectors, including those identified as priorities. In addition, effective horizontal policies are often a prerequisite if vertical policies are to yield positive results.
In this regard, improving access to ICT can in fact be seen as an important horizontal policy aimed at improving the productivity of firms in all sectors that actively use ICT services. At the same time, not all countries can or should aspire to becoming a major hub for the development of cutting-edge ICT, given their comparative advantages.
A country’s strengths may lie in the application of cutting-edge technology in medium or low-tech sectors, such as food or textiles. These sectors are often overlooked by innovation policies (which tend to target cutting-edge innovation in high-tech sectors), but they may deliver sizeable returns to innovation.
Third, vertical policies should make effective use of private-sector participation and co-financing. Private-sector involvement provides an independent assessment of the commercial viability of projects which are selected to receive preferential treatment and reduces risks associated with governments picking winners. Private-sector involvement can also strengthen publicly funded education and training programmes. For example, the Estonian Association of Information Technology and Telecommunications (EAITT), an industry association, plays a leading role in the development of clusters and the design of vocational and university education programmes.19
Private-sector involvement can also help countries and regions to pursue “smart specialisation”. Rather than targeting entire sectors, such as ICT or biotechnology, this approach focuses on promoting investment in particular activities that can strengthen comparative advantages in existing or new areas, rather than targets.20 One such example is precision farming – the management of farming practices using computers, satellite positioning systems and remote sensors. These determine whether crops are growing with maximum efficiency given the specific local environmental conditions and form the basis for decisions on seed rates and the application of fertilisers and agrochemicals. In food processing, ICT can be used to record a product’s every movement and the various stages of the production process using barcodes or radio-frequency identification (RFID) tags and other tracking media. Such traceability is a key risk management tool, allowing food businesses and authorities to withdraw or recall products which have been identified as unsafe. In the EU, traceability has been compulsory for all food and feed businesses since 2002.
Such smart specialisation relies on entrepreneurs identifying market opportunities and promising areas in which to specialise. The role of the government is to provide an environment that allows this process to happen and remove obstacles to the development of promising new activities.
Source: EBRD innovation policy questionnaire and authors’ calculations.
Note: This chart ranks priority areas for innovation spending in descending order according to the percentage of countries that regard them as “highly important” or “important”.
The analysis in this chapter shows that countries at different stages of development vary in terms of their ability to use and create knowledge. This ability is shaped by the quality of institutions, macroeconomic stability, and the functioning of product, labour and financial markets. It is also determined by specific conditions underpinning a country’s ability to effectively access and absorb existing technology and create new technology.
Transition countries perform reasonably well in terms of access to technology, but they lag behind advanced economies and many other emerging markets when it comes to absorptive and creative capacity. Analysis reveals that transition countries have surprisingly similar innovation policies, despite the underlying differences in these countries’ potential for knowledge-based growth and the ways in which their firms tend to acquire knowledge. This indicates that the stated policy targets and instrument mixes are, in most cases, insufficiently tailored to the specific circumstances of these countries.
In particular, innovation policies in the region tend to follow trends set by advanced economies, focusing on the creation of new technology. There is an overarching focus on developing high-tech industries and improving the contribution that public research organisations make to innovation performance, seemingly with the aim of creating the next Silicon Valley.
However, this kind of “one size fits all” approach may not suit many transition countries. Given that these countries are not yet operating at the technological frontier, policies need to prioritise improvements in absorptive capacity. Such improvements can be achieved through greater economic openness, better secondary education and professional training, better management practices, and policies that alleviate credit constraints.
As countries develop and approach the technological frontier, innovation policies need to evolve. They should place greater emphasis on helping firms to improve their capacity to create knowledge by facilitating the supply of specialist skills and specialist finance, strengthening competition and facilitating the entry and exit of firms.
While policy instruments and priority areas need to be tailored to the specific circumstances of countries, innovation systems could usefully imitate the governance and general policy design seen in advanced economies. They should also ensure maximum transparency when allocating innovation support and striking an appropriate balance between horizontal and vertical policy elements.
To be effective, vertical innovation policies focusing on support for particular sectors require high standards of governance and high-quality economic institutions. Given the weak economic institutions in many transition countries, such policies may not suit many of them. The high risk of manipulation by interest groups may outweigh the potential benefits of more targeted support. Instead, policies should initially prioritise improvements in institutional quality and address common bottlenecks affecting innovation in all sectors (such as poor skills among the workforce or burdensome customs and trade regulations).
If direct government support is provided to particular sectors or firms, such vertical policies should make effective use of private-sector participation. This would provide an independent assessment of the commercial viability of projects receiving preferential treatment and encourage smart specialisation. Policy instruments need to include clear conditionalities linked to addressing the bottlenecks identified. They should also specify exit strategies to mitigate the risk of firms becoming addicted to support.
Policies should be subject to regular evaluations, with reviews linked to these evaluations. Thus, the design and implementation of effective innovation policies requires a sophisticated public administration with the capacity to regularly evaluate a country’s strengths and weaknesses and collect the data necessary to conduct such assessments. This calls for the quality of public administration to be improved in the area of innovation policy, for instance by providing universities with the resources and incentives needed to properly train future civil servants. That may, in itself, be an important aspect of a country’s innovation policy mix.
Back in the early 1990s Estonia had similar conditions to Latvia and Lithuania in terms of innovation and the development of ICT. These countries have since followed separate development paths, and they now differ significantly in these areas. Estonia is currently the highest scoring transition country in terms of innovation potential, while Latvia and Lithuania lag some way behind (see Chart 5.1.1).
Estonia began to develop its ICT infrastructure at an early stage. When it gained independence, only half of the population had a phone line. By 1997, however, 97 per cent of Estonian schools had internet access. The first public Wi-Fi area was created in 2001, and most public locations now have wireless internet access. Indeed, by May 2013, 4G services covered over 95 per cent of the country. Estonian citizens can now use the internet to vote, transfer money and access information that the state holds on them – all using the identity card introduced in 2002.
Estonia’s innovation policy formally began in 2000 with discussions regarding the first Knowledge-Based Estonia (KBE) strategy, which covered the period 2002-06. This strategy drew on the experiences of Finland and Sweden,21 taking account of specific development opportunities, the existing research potential and the country’s economic structure, as well as other Estonian development strategies.22 The two main objectives were updating Estonia’s knowledge pool and increasing the competitiveness of its companies. The three key areas for Estonian research, development and innovation (RDI) were (i) user-friendly information technology and the development of an information society; (ii) biomedicine; and (iii) material technology.23
In order to achieve these objectives, the KBE strategy established a set of measures spanning four key areas (see Table 5.1.1). These measures sought to increase gross domestic expenditure on R&D (GERD) to 1.5 per cent of GDP by 2006. They also aimed to rebalance expenditure on research and development, seeking to shift the breakdown between the two from 90:10 to 60:40 by 2006. To increase the effectiveness of its RDI system, Estonia adopted location-based policies, creating science parks and regional business incubators. Lastly, Estonia used international cooperation not only as a means of attracting foreign knowledge and technology, but also as a way of building research teams with critical mass and avoiding “brain drain”.
The 2002-06 programme produced mixed results. In terms of R&D financing, GERD accounted for 1.13 per cent of GDP in 2006, below the target level. As a result of this shortfall in financing, national R&D programmes in selected key areas were not launched and financial support for graduate and postgraduate studies did not increase substantially. However, growth in corporate R&D outpaced growth in public-sector R&D. By 2006 the corporate sector accounted for 44 per cent of GERD, exceeding the target by some distance. Estonia was also successful in attracting foreign R&D investment, which grew from 13 to 16 per cent of GERD, higher than the EU average of 7 to 8 per cent. This was evidence of stronger links between Estonian RDI and the rest of the world.24
The KBE strategy for the period 2002-06 has been followed by similar strategies for the periods 2007-13 and 2014-20. A number of governmental and independent bodies have conducted assessments looking at the progress made under the first two strategies.
Each strategy has taken account of the experience and expert recommendations resulting from the preceding period and set more ambitious objectives, with targets increasing in number and scope (see Table 5.1.2). The key areas have been adjusted over time, but the overall priorities have not. The focus continues to be on ICT, health technology and services, and more efficient use of resources.25
This “systemic” approach to innovation policy has produced results. In 2012 Estonia’s GERD stood at 2.2 per cent of GDP (higher than the average across the EU-15). Meanwhile, the percentage of GERD accounted for by the corporate sector had risen further to stand at 57 per cent, approaching the EU-15 average (see Charts 5.1.2 and 5.1.3). Estonia was also one of the few EU countries that broadly maintained the same level of spending on public R&D during the crisis. In both Latvia and Lithuania, on the other hand, government-financed GERD declined as a percentage of GDP during this period.
Improvements can also be seen in terms of scientific and innovation output (see Chart 5.1.4). Estonia still lags some way behind Finland when it comes to patent applications, but it is catching up in terms of published articles. Moreover, in 2010 similar percentages of Estonian and Finnish firms introduced product or process innovations. Meanwhile, Latvia and Lithuania both trail behind Estonia for all indicators of R&D spending and output.
Source: World Economic Forum (2013) and authors’ calculations.
Note: The scores for each indicator range from 1 to 7, where 1 corresponds to the worst possible outcome and 7 corresponds to the best possible outcome. Scores for “macroeconomic stability” are not shown, given the extraordinary circumstances affecting this broad framework condition in the review period.
| Key areas | Types of programme/initiative |
|---|---|
|
Financing of R&D |
Targeted financing R&D grants and loans for firms and research institutes Infrastructure of R&D institutions Risk capital scheme |
|
Development of human capital |
In-service training scheme for engineers and specialists Funding for masters and doctoral studies (including studies abroad) Funding for university infrastructure Scheme to involve PhD graduates and post-doctoral students in RDI Multifaceted courses allowing students and researchers to acquire management and business skills |
|
Increasing the effectiveness of RDI systems |
Regular collation, storage and dissemination of scientific information Innovation awareness programme Training programme focusing on the management of RDI Science and technology parks in Tallinn and Tartu and incubators in the regions Liaison between research and industry, and research-intensive spin-offs |
|
International cooperation |
Stronger Estonian participation in international RDI networks Network of Estonian technological attachés |
Source: Reid and Walendowski (2006).
| Period | Objectives |
|---|---|
|
2002-06 |
An updated knowledge pool An increase in the competitiveness of Estonian companies |
|
2007-13 |
Competitive and more intensive R&D Innovative entrepreneurship, creating new value in the global economy An innovation-friendly society targeting long-term development |
|
2014-20 |
A diverse range of high-quality research in Estonia R&D that acts in the interests of Estonia’s society and economy R&D that makes the structure of the economy more knowledge-intensive An active and visible role for Estonia in international RDI cooperation |
Source: KBE 2002-06, KBE 2007-13 and KBE 2014-20.
| EU-15 | Estonia | Latvia | Lithuania | Finland |
Source: Eurostat and authors’ calculations.
Note: Other GERD includes business enterprise, higher education and private non-profit GERD.
Source: Eurostat and authors’ calculations.
| Estonia | Latvia | Lithuania | Finland |
Source: Eurostat, Web of Science and authors’ calculations.
Note: Patents per million inhabitants are calculated as patent applications to the European Patent Office by priority year per million inhabitants. The percentage of innovative firms is taken from the Community Innovation Survey and includes product and process innovation, but not organisational or marketing innovation.
While 80 per cent of the transition countries that participated in the EBRD’s survey on innovation policy in summer 2014 regarded support for the transfer of technology from science to industry as important or highly important, only half of them regarded support for firms’ adoption of existing technology as equally important.
On closer inspection, even in those countries where the adoption of existing technology is an explicit priority, policies typically focus on fostering links between industry and science, rather than helping firms to absorb and adapt foreign technology.
Public support for the transfer of technology comes in different forms. It includes: R&D cooperation centres; technology transfer offices; grants promoting cooperation between industry and science; innovation vouchers (which can be used for specific purposes); exchange programmes for people working in academia and industry; and information dissemination services.
For instance, in the early 2000s Hungary established a network of 19 cooperative research centres (CRCs) and 19 regional knowledge centres (RKCs)26 with the aim of strengthening links between industry and science and promoting the spread of technology.27 Between 2007 and 2009 public support provided to firms by those CRCs and RKCs totalled €34 million. This support helped them to purchase equipment, acquire external expertise and protect intellectual property rights. In addition, 15 technology transfer offices help researchers in major universities with their patenting, licensing and fundraising activities.28
Many countries finance joint R&D projects that bring together representatives of the scientific community and industry. In Armenia, for instance, the State Committee of Science, which was established in 2007, supports cooperation between industry and science in areas chosen by public agencies where there is the potential for research to be commercialised. In 2011, for example, 11 projects received funding totalling €2.4 million.29 In Moldova, the Agency for Innovation and Technology Transfer provides grants to small consortiums of researchers and businesses conducting innovation and technology transfer projects (with a total of 17 projects being supported in 2014). Projects are selected annually on the basis of a competitive evaluation of funding proposals. At least 50 per cent of a project’s funding must come from private sources and can be in-kind.30 The programme’s overall budget for the period 2005-12 totalled €5.3 million.31
Some countries use innovation voucher schemes to foster the transfer of knowledge from academic and public research organisations to SMEs. In 2008, for example, Bulgaria launched a scheme which covers the cost of consultancy services provided by external experts. Two options are available under the scheme: vouchers for up to €2,500 and vouchers for up to €7,500. The latter requires co-financing totalling at least 20 per cent. This programme’s budget for the period 2008-10 was €2.3 million.32
Staff exchanges are another important channel supporting the transfer of knowledge between different parts of a national innovation system. Between 2007 and 2009 Romania provided funding to PhD students undertaking three months of cross-sector training in a public or private research laboratory as part of a human resources programme under the 2007-13 National RDI Plan.33 The maximum financial support provided was RON 8,500, covering mobility expenses and up to 30 per cent of charges for access to research infrastructure.34
Some countries also use information dissemination services to promote awareness of new technologies and inventions among the business community. In 2012 the Kyrgyz Republic launched a three-year programme aimed at innovative SMEs with a budget of €17,000. An initial survey was conducted in order to analyse the use of new technologies and the level of innovation in the country. Nine public centres providing patent search services have now been established, and training for SMEs focusing on the transfer of technology is scheduled for 2014.35
Significant amounts are being spent on the transfer and spread of technology, but it is not entirely clear whether these initiatives are proving successful in terms of creating better links between science and industry. Box 5.3 looks at the results in more detail.
The previous box reviewed various schemes for fostering links between industry and science. To assess the effectiveness of such initiatives, we can look at various indicators of links between the two.
One such indicator is based on patent information. It is available for all countries over a long period of time, but it covers only a fraction of the links between industry and science. It looks only at the information contained in patents, so it is unlikely to capture the majority of the links between industry and science, particularly in countries that are in the process of catching up with the technological frontier.36
Chart 1.15 in Chapter 1 showed that, when compared with the United States or Germany, a remarkably large percentage of patents in transition countries are applied for by universities or public research organisations. This is particularly true of Russia, Poland and Ukraine, where more than a third of all patents are held by universities or research institutes. In countries such as Estonia, Slovenia and the Czech Republic, academic patenting is much closer to the levels observed in the United States and Germany. Meanwhile, Turkey has very low levels of academic patenting.
Furthermore, while co-patenting involving academia and industry is relatively rare everywhere, its incidence in the transition region is relatively high compared with the United States. Russia stands out in this regard, accounting for 62 per cent of all co-patenting in the transition region. This suggests that universities and research institutes have a high degree of involvement in the development of technology, especially in Russia. Consequently, links between industry and science in transition countries such as Russia mostly involve the scientific community supplying new technology to industry.
The picture is dramatically different when looking at such links from the perspective of corporate demand – in other words, when looking at how often corporate patents refer to scientific literature (scientific non-patent references) as prior art for patented inventions.
When assessed on the basis of this indicator, Russia and Ukraine score very poorly (see Chart 5.3.1). Latvia, Slovenia, Hungary and Estonia, on the other hand, score much better than other major patenting countries in the transition region, albeit they still lag behind the United States. Israel scores almost as highly as the United States on this indicator. With few patents being used as prior art for further patenting by firms, the impact of academic patenting in the transition region is likely to be limited in practice.
Thus, these data suggest that what is lacking in most transition countries – including those where the scientific community develops a lot of new technology – is a corporate sector that actively uses its links with science to innovate. There is a policy bias in this regard, with countries stimulating the supply of new technology – rather than demand for it – without much regard for the country’s level of innovation.
Overall, this assessment raises the question of whether industry actually needs the results of scientific research conducted by local public institutions and whether it has sufficient capacity and incentives to take those findings on board. It also indicates that policies need to pay greater attention to industry demand in the area of innovation.
Source: PATSTAT and authors’ calculations.
Note: Data cover all patent applications reported in PATSTAT that originate in the relevant country. The figure for the transition region is an unweighted average, including only countries with at least 1,000 patent applications. This leads to the exclusion of Albania, Armenia, Azerbaijan, Bosnia and Herzegovina, Egypt, FYR Macedonia, Georgia, Jordan, Kazakhstan, the Kyrgyz Republic, Mongolia, Montenegro, Tajikistan, Tunisia and Uzbekistan. Croatia is not included because its sectoral allocation is not reliable.
Location-based innovation policies can be found in almost all transition countries, typically in the form of science, technology and research parks, technology centres, and designated science cities (see Chart 5.4.1).
Location-based policies are fairly popular in central Europe and the Baltic states – particularly in Hungary, where more than 200 industrial parks can be found. They are even more popular in Russia. The former Soviet Union pioneered innovation-oriented location-based policies, which were underpinned by public investment in science and fundamental research. The innovation model followed by the Soviet authorities as of the early 1930s involved the creation of “special-regime enclaves intended to promote innovation”.37 These enclaves initially took the form of secret research and development laboratories (referred to as Experimental Design Bureaus or, more commonly, sharashkas) in the Soviet Gulag system. They were later followed by science cities, closed cities and academic cities.
Today, 14 locations are officially designated as naukograds (science cities). In addition, the country has almost 30 national research universities (NRUs) and numerous business incubators, technology parks and technology transfer centres, as well as five special economic zones (SEZs) focused on innovation, and the Skolkovo innovation centre.38 In some of these locations, a pilot programme for innovation-oriented hubs was launched in 2012.
Most of these parks are linked to a specific university or research institution and publicly funded (particularly in Russia), further highlighting the focus on the supply of new technology. However, there are exceptions, such as Technopolis Pulkovo (a commercially funded science and technology park in St Petersburg), which is wholly owned by Technopolis plc, a Finnish public limited liability company.39 The park aims to support knowledge-intensive companies and start-ups and foster links between academia and industry, which should contribute to the diversification of the region’s economy. There is also expected to be some transfer of management skills from the team of international executives overseeing the operation of the park to their local Russian colleagues.
The rationale for location-based policies stems from the expectation that they will result in localised knowledge spillovers and lead to stronger economic growth. Knowledge-oriented location-based policies have so far received less attention than other location-based initiatives, not least because innovation and its outcomes are hard to measure. In general, empirical evidence on the performance of science parks – one of the most popular knowledge-oriented, location-based policy instruments – is mixed.40
In fact, there are hardly any studies of this kind for transition countries. Statistics available for Russian SEZs and innovation hubs suggest that firms located there are successful in terms of introducing new products and technologies and being granted patents, and that they spend more on R&D than other firms (see Chart 5.4.2). However, it is impossible to know whether they would achieve the same results if they were located outside these clusters.
Most existing evaluations of location-based policies are focused on short-term outcomes, making it difficult to judge the extent to which these policies contribute to stronger economic growth and have a more permanent impact. A recent study looked at the impact that Soviet-era science cities – towns with a high concentration of R&D facilities, as well as human capital – had on firms’ innovation activities in the period covered by the fifth round of the Business Environment and Enterprise Performance Survey (BEEPS V). The study found that firms located in former science cities were an average of 6 to 9 percentage points more likely to introduce new products than similar firms located elsewhere. They were also an average of 7 to 8 percentage points more likely to introduce new processes. This impact is substantial, considering that around 13 per cent of firms located outside former science cities were engaged in either product or process innovation.41 It provides some evidence of the persistence of accumulated human capital, resulting in localised spillovers of knowledge.
Firms located in academic towns (akademgorodoks), on the other hand, were an average of 8 percentage points less likely to introduce new products than similar firms located elsewhere. This provides further evidence that emphasis on the supply side does not necessarily improve industry’s demand for innovation or result in higher rates of product innovation among local firms.
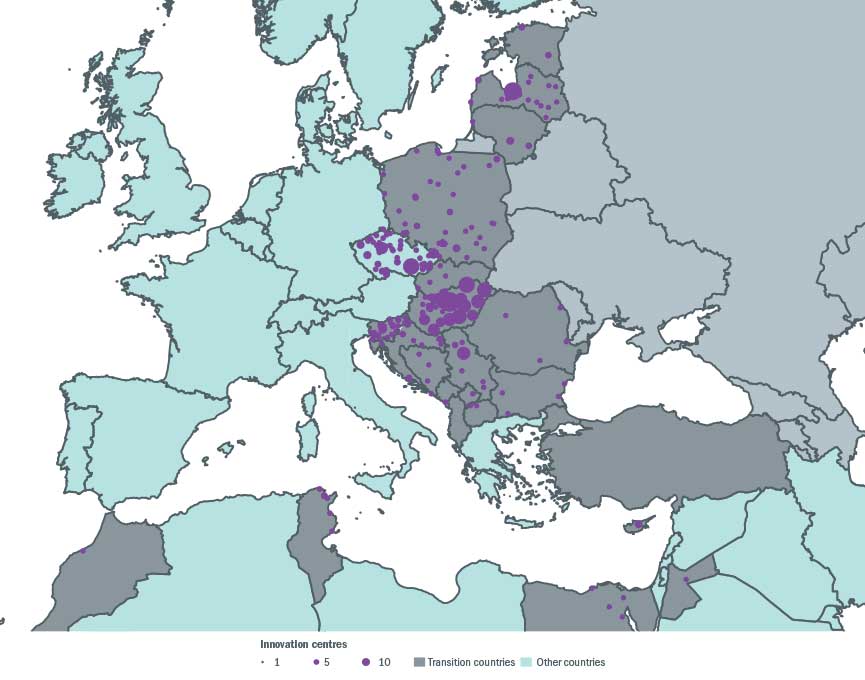
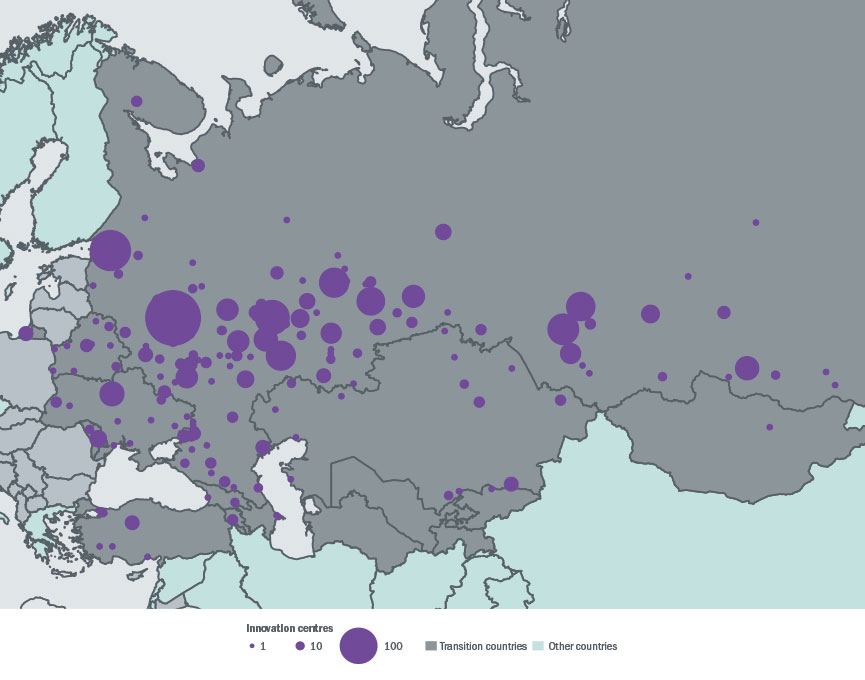
Source: EBRD innovation policy questionnaire and various public sources.
Note: These maps show the location of business incubators, centres of excellence, industrial parks, innovation-oriented SEZs and other related types of clusters.
Source: Russian Ministry of Economic Development, and Gokhberg and Shadrin (2013).
Note: Data in Chart 5.4.2a relate to the period 2005-13.
Almost all countries in the transition region regard ICT as a priority area when it comes to innovation. Armenia, Azerbaijan and Egypt, for example, all singled out the ICT sector as a driver of growth in the early 2000s. However, they have used different measures to support the development of the ICT sector and have made progress at different speeds.
ArmeniaArmenia was one of the major R&D and production centres for computer science, electronics, precision engineering and chemicals in the former Soviet Union.42 When many of these industries were shut down in the early 1990s, a number of highly qualified professionals emigrated and established companies abroad. However, they then contributed to the rise of the local ICT industry by creating development centres back home in Armenia.
In 2000 the government recognised the ICT sector’s potential and declared its development a national priority. In 2002 it established the Enterprise Incubator Foundation (EIF), a one-stop support agency for innovative ICT companies. The agency delivers business and workforce development services, along with consultancy services and legal and financial support, with a focus on start-ups.43
The EIF has conducted several projects with international ICT companies, including firms with no specific ties to the Armenian diaspora.44 Notable examples include the launch of the Cisco Systems Networking Academy Program in 2010, which fosters computer and software penetration in business and education, and the launch of the Microsoft Innovation Center in 2011, which provides resources and infrastructure to SMEs and start-ups in the ICT sector. In addition, a number of events targeting start-ups have taken place in Armenia in 2014, including the sixth BarCamp Yerevan, Digicamp, the launch of the Hive tech start-up accelerator and Seedstar Yerevan.
The ICT and high-tech sectors are among the fastest growing industries in Armenia. The number of ICT companies in Armenia has grown from around 175 in 2008 to around 380 in 2013. What is more, in 2011 exports accounted for 44 per cent of these firms’ revenues. However, the development of the ICT sector is being constrained by a shortage of skilled labour with IT training. Several initiatives have been devised in order to overcome this problem. They include Sun Training Labs, a project established by the EIF, Sun Microsystems Inc. and USAID with a view to strengthening the skills of university graduates, and the Synopsys Armenia Educational Department, which provides training in microelectronics in partnership with major Armenian universities.45
Since the early 2000s Azerbaijan has acknowledged the importance of developing its non-oil sector and diversifying its resource-based economy. Until 2010 the focus was mostly on improving infrastructure, resulting in communications networks being completely digitalised and the capacity of external internet channels being increased. The liberalisation of the telecommunications market has opened up opportunities for the private sector and tariffs for unlimited broadband internet have plummeted.
A number of other initiatives have been carried out in recent years. The country’s e-government portal was launched in November 2011, with a total of 40 state agencies signing up by 2013.46 Total investment in ICT – both state and private investment – more than doubled between 2009 and 2011. Azerbaijan’s high-technology park was launched in 2012, and its business incubation centre had accepted a total of 20 projects by March 2014. The country branded 2013 “The Year of ICT” and launched its Online Presence Project, which seeks to improve the accessibility of government and public institutions, as well as private companies, via online channels.47 In July 2014 the State Fund for the Development of IT, which was established in 2012, awarded grants to 31 start-up projects in areas such as high-technology, e-payment software applications, air navigation systems and e-government.
2013 also saw the establishment of the University of Information Technology and the launch of Azerbaijan’s first telecommunications satellite, AzerSpace-1. These developments will improve the quality of telecommunications throughout the Caucasus and foster the development of Azerbaijan’s space industry.
Overall, Azerbaijan’s ICT sector has grown by an average of 25 to 30 per cent per year over the last decade, becoming the second largest recipient of foreign investment after the oil industry.
Similar to Armenia, Egypt drew up an ICT master plan in 2000 and launched the Egyptian Information Society Initiative, which aimed to foster Egypt’s transformation into an information society and a hub for the offshoring and outsourcing (O&O) of ICT services. The Information Technology Industry Development Agency (ITIDA), which was established in Egypt in 2004, serves as a one-stop shop for O&O investors.
In recent years increasing emphasis has been placed on stimulating the provision of high-value and innovative ICT services. In 2010 the Technology Innovation and Entrepreneurship Centre (TIEC) was established with a view to supporting innovative ICT companies and start-ups. Success stories include SilGenix (a semiconductor intellectual property company specialising in on-chip power management solutions for system-on-chip products) and Bey2ollak (a mobile app for sharing real-time information about traffic in Cairo and Alexandria).
Since 2007 ITIDA and the Information Technology Institute have been running the EDUEgypt programme, which provides students (8,735 of them in 2012) with professional training in business process outsourcing (BPO) and IT outsourcing. Moreover, in 2013, in cooperation with Intel, the TIEC organised the Egypt Ideation Camp, a skills training workshop targeting young people. It also runs an innovation recognition programme which unearths young talent and provides links to the industry.
The O&O industry has grown strongly in recent years, as has the wider ICT sector. Exports of IT and BPO services totalled more than EGP 9 billion in 2012, with around 45,000 people employed in O&O centres,48 working for firms such as IBM, Oracle, Orange, Vodafone and Yahoo.
In 2011 Egypt was ranked fourth in the Global Services Location Index, a list of the world’s most attractive offshoring destinations, up from 12th place in 2005.49 In 2014 Cairo and Alexandria were ranked 76th and 81st, respectively, in Tholons’ list of the top 100 outsourcing destinations, with Cairo dropping 18 places compared with 2013 (mainly because of the continuing political unrest).50
Competition policy and private-sector innovation lie at the heart of a successful transition to a well-functioning market economy. Without an effective competition framework, monopolies and restrictive trade practices may emerge, stifling private-sector growth. Indeed, the ubiquitous role of the state in the country’s planned economy may simply be replaced by dominant firms controlling segments of a distorted market economy. A sound competition policy will create a level playing field, thereby facilitating the entry of new market players and the introduction of new products and production processes.
The relationship between competition and innovation is a complex one. More competition does not necessarily yield a higher level of innovation.51 This does not imply that the enforcement of competition law should be more lenient in innovative industries relative to other sectors. It does indicate, however, that specific events which affect competition and market structures should be assessed by competition authorities in terms of how they influence innovation. A sound competition policy will identify the effect that a specific event (such as a merger) has on the long-term incentives and innovative capacities of the firms involved.52 In this way, competition authorities can play an important role in promoting innovation – either by curtailing or preventing conduct that is detrimental to innovation, or by fostering conduct that promotes it.
In recent years the EBRD has placed renewed emphasis on supporting innovation. Notably, in 2014 the Bank launched the Knowledge Economy Initiative, aimed at helping to identify, invest in and implement projects and policies that will improve competitiveness through innovation. However, many countries in the EBRD region are making little progress in implementing competition policies that will facilitate greater innovation. The Transition Report 2013 concluded that much of the region appeared to be “stuck in transition”,53 indicating that competition policy was one area in which many transition countries had struggled to make significant progress.54
Competition policy: the competition indicatorThe EBRD’s transition indicators have been mapping economic transition in the region since the Bank was first established. One of those indicators looks at the quality of competition policy, basing its assessment on survey responses and in-depth research undertaken by the Office of the Chief Economist. The survey is conducted every year, collecting information on both the institutional environment in which competition authorities operate and the actual enforcement of competition law (see Box A.5.1.1). The scoring system for the competition indicator ranges from 1 (denoting a complete absence of competition legislation) to 4+ (denoting the kind of competition framework that is typical of an advanced industrialised economy).
The most recent transition indicator scores for competition across the countries in the EBRD region are shown in Chart A.5.1.1,55 while Chart A.5.1.2 plots average regional variation in that indicator between 1997 and 2013.
The data show that the best-performing region is central Europe and the Baltic states (CEB), with an average score of 3.37. This reflects the fact that EU membership provides strong incentives and a collective anchor, encouraging market reforms. These countries aligned their legislation with the EU’s acquis communautaire as part of their accession programmes, which is reflected in the significant increase in scores between 1997 and 2013. Enforcement activities have also increased, with competition authorities generally being equipped with adequate resources and staff. However, owing to the financial crisis and increased pressure on government budgets, several countries have seen a reduction in the resources allocated to competition authorities, together with a reduction in the number of investigations conducted.
All the countries of south-eastern Europe (SEE) have scores of between 2.0 and 3.3. The experiences of these countries demonstrate the challenges faced when seeking to strengthen the institutions that implement competition policy.
Indeed, although Bulgaria and Romania have been EU member states since 2007 and most other SEE countries have taken major steps to align their institutional frameworks with the EU’s acquis communautaire in view of their aspirations for future accession (translating into increases in their competition policy scores), the SEE region’s enforcement record has been uneven.
Significant action remains necessary to improve the implementation of competition law, which will involve strengthening the resources and institutional capacity of regulators, as well as developing the skills available to courts reviewing competition authorities’ decisions. The lack of adequate skills is reflected in these countries’ poor enforcement records, especially as regards the abuse of dominant positions and cartels. In such cases strong investigative tools are needed to collect and process evidence and significant expertise is required, in order to conduct the economic analysis needed to prove that rules have been violated.
Eastern Europe and the Caucasus (EEC) and Central Asia have two of the lowest average scores, averaging 2.1 and 1.8 respectively. These scores – and indeed the minimal progress observed over the years (as shown in Chart A.5.1.2) – reflect poor institutional environments and strong state involvement in the economy, especially in Central Asia.
Nevertheless, promising reforms have recently been introduced in a number of countries (such as Moldova and Georgia), with new competition legislation being adopted and competition authorities being established and strengthened.
This may pave the way for more effective prosecution of anti-competitive behaviour in the future. However, much will depend on the authorities’ ability to develop the necessary skills, competence and experience, as well as their ability to act as a public advocate for competition policy and compliance with the relevant rules.56
The countries of the southern and eastern Mediterranean (SEMED) region, which have only recently been included in the EBRD’s assessment of competition policy, also have low scores, indicating that there is significant scope for improvement. The low scores in the SEMED region are related to both institutional and enforcement issues. Competition authorities in SEMED countries are often insufficiently independent of government, especially when it comes to mergers. From an enforcement perspective, their lack of adequate resources and skills also represents a major problem. In addition, regulatory capture has sometimes prevented competition authorities from challenging established interest groups in these countries.
Overall, this transition indicator shows that governments need to strengthen their competition frameworks, especially in regions lying outside the EU’s direct sphere of influence. This should be a priority, given the importance of competition policy as an anchor for private-sector development and given that competition policy is generally lagging behind other reform areas in the EBRD region.57
However, reform efforts must also take account of the fact that competition policy does not function in isolation and is embedded in a country’s wider institutional system. Reforms to competition policy should occur in parallel with improvements in the effectiveness and transparency of the judiciary, especially as regards the courts’ role in reviewing administrative decisions made by competition authorities.
Since 2012 the EBRD has gone beyond analysing this transition indicator, looking in more detail at the efforts made by a number of countries to respond to institutional challenges in the area of competition policy. Particular attention has been paid to south-eastern Europe, where a basic competition framework is in place and institutional shortcomings now represent the main obstacles to progress. This is where the real challenge lies. Adopting competition legislation and regulations and setting up new organisations is relatively easy; making those organisations run effectively is much more difficult.
It is clear from discussions with counterparts and practitioners in the SEE region that the views of local stakeholders regarding the competition policies of these countries are in line with the relevant transition indicator scores. These people repeatedly tell the same basic story, explaining that while the laws on the statute book are generally in good order, their implementation needs to be improved.
This kind of implementation gap is typical of the evolution of legal frameworks in the transition region. At the same time, there is a keen awareness in government circles of how important it is to strengthen the effectiveness of organisations involved in implementing and enforcing competition policy. Two activities are especially important in this regard: efforts to help courts deal with competition-related matters and measures to strengthen the institutional capacity of competition authorities. Some brief examples of each are discussed below.
In 2012 the authorities in Bosnia and Herzegovina launched a project aimed at strengthening the skills of the judiciary in the area of competition law. Recent EU reports had noted that, although the country’s Competition Act of 2005 was largely in compliance with the acquis communautaire, implementation remained uneven. This was in line with the country’s transition indicator score of 2.3.
A module of judicial training was prepared, together with a specialist handbook for judges at the Court of Bosnia and Herzegovina (which hears appeals against the regulator, the Competition Council). Judges had not previously received any training in the field of competition, and few had any real experience in this area. One striking statistic was the fact that the Court had never ruled against the Competition Council in a claim brought by a private entity seeking to challenge a decision.
Special attention was paid to the discretion and legal remedies available to the Court when resolving claims in these areas, as well as awareness of the relevant market, economic and financial aspects of competition matters. In the view of both the authorities providing the training and the judges participating in it, the training module filled an important gap in the judges’ education and put them in a better position to effectively review the decisions of the Competition Council.
In 2013 a programme of judicial training was implemented by the Serbian authorities for the benefit of judges of the Administrative Court, which hears appeals against decisions of the Commission for the Protection of Competition (CPC). (Serbia’s current transition indicator score for competition is 2.3 – again pointing to problems with the implementation of its competition framework.)
For the authorities in Serbia, the focus of concern was on strengthening judges’ knowledge of the economic concepts that underpin competition law. The first question that arises in many competition cases concerns the definition of the relevant market. This involves the application of specific techniques, requiring an understanding not only of how markets work, but also of general economic theory.
The Administrative Court worked with the Judicial Academy of Serbia and the Centre for Liberal Democratic Studies in Belgrade, developing a training programme that covered areas such as: economic analysis for defining markets; economic analysis of monopoly power and price discrimination; and dominant market positions and their abuse (including predatory pricing and restraint of trade). The programme involved a series of seminars by leading Serbian academics, as well as guest lectures by judges from Croatia, the Czech Republic, Hungary and Romania.
An assessment of the project found that the training programme had improved the ability of judges to deal with competition matters effectively, providing them with a solid grounding as regards the application of economic concepts in competition cases. The project also led to the establishment of a variety of training resources. A dedicated website was created, which hosts all of the training material for the programme, as well as recordings of the various seminars and a self-test facility allowing participants to check their knowledge of the course content.
These capacity-building initiatives are welcome developments. Judges in administrative courts are often required to deal with non-legal disciplines pertaining to the jurisdictions of the administrative bodies whose decisions they are reviewing. The economics of competition cases is just one example; accounting matters relating to taxation cases are another major issue. It is important that such capacity-building initiatives are sensitive to judges’ training needs – not only as regards substantive law, but also as regards such associated non-legal areas.
Judges do not necessarily need to have extensive expertise in these areas, but they must have a sufficient grasp of the relevant issues to be able to understand disputes, ask probing questions of counsel and expert witnesses, and come to well-reasoned conclusions, applying all of the academic disciplines relevant to the case.
Institutional reforms have also been observed at competition authorities elsewhere in the SEE region. In late 2013 Serbia’s Commission for the Protection of Competition undertook a capacity-building exercise similar to that conducted at the Administrative Court. The training course on economic concepts that had been provided to these Serbian judges was revised and reworked for the CPC, since a higher level of specialisation and economic knowledge was expected of its members.
The training programme developed by the Serbian authorities covered the various microeconomic concepts underpinning competition policy and regulation, looking at their relevance for members and staff of the CPC (especially case handlers and decision-makers). One new element was a component explaining the relevance of econometric techniques in detecting violations of competition rules.
The project lasted several months and was concluded at the end of 2013. The CPC believes that this programme has improved its members’ ability to effectively employ economic concepts and techniques in their work. It has also led the CPC to review its overall development needs, looking at other ways of increasing its effectiveness.
Indeed, a second, more ambitious project was launched in 2014 with the aim of building on that earlier work and making significant improvements to the CPC’s general operational capacity. The 18-month project contains four main components.
First, CPC members will be given further training on how to conduct their own econometric studies. On-the-job training is considered to be the most effective way of doing this, building on the basic training given to members in 2013. The CPC will also acquire software facilitating the implementation of such econometric studies, and will organise training on the use of such tools.
The second component will involve practical advice and training to enable the CPC to make greater use of its statutory powers to conduct dawn raids. Various observers (including the European Union) have encouraged the Serbian authorities to exercise these powers in appropriate cases. However, entering premises and seizing evidence is an intrusive measure and needs to be carried out in a judicious manner, especially as the public are not accustomed to such procedures. Furthermore, the proper use of forensic software is required for analysing data seized in dawn raids.
The third component of the project will enhance members’ capacity to perform the CPC’s role as a public advocate for competition policy in Serbia. This is an important function, which has the potential to raise public awareness of competition policy in a country where competition rules are still not well understood and in some cases remain counter-intuitive for the general public. The CPC wishes to be more visible in the eyes of the general public and raise its profile in Serbia’s competition community.
The final component will facilitate closer cooperation between the CPC and sector-specific regulators, primarily the telecommunications and broadcasting regulator and the energy regulator. The CPC and the sector-specific regulators require a better understanding of the division of responsibilities between them, as well as the importance of approaching certain issues in a harmonised manner.
These represent significant steps and should allow Serbia to increase the effectiveness of its institutions and make progress in the area of competition policy. If all the above measures are implemented successfully in the course of the project, significant improvements can be expected in the implementation of competition law in Serbia. Such changes should be reflected in improvements in Serbia’s transition indicator for competition.
Some countries’ reform efforts have directly addressed the question of the interaction between competition policy and innovation. For example, Montenegro’s Agency for the Protection of Competition is running training sessions for its members and staff focusing on European approaches to merger control. One of the sectors being analysed is the pharmaceutical sector, which will be an opportunity for participants to consider the implementation of merger control and competition policy in innovative industries.
Meanwhile, Moldova’s Competition Council is developing its ability to conduct in-depth market investigations. This will entail a combination of seminar-based training and on-the-job learning, whereby international experts will work side-by-side with the Council to deliver a full assessment of a particular market and develop policy recommendations. The Council will select a sector involving substantial innovation, in order to gain experience of the potentially complex interplay between competition policy and innovation.
Of course, government efforts to strengthen institutions responsible for enforcing competition rules are not always explicitly linked to the objective of promoting innovation. However, the EBRD considers that this objective is served whenever such institutions are strengthened. This is consistent with the view that competition policy must also apply to innovative sectors, with each case being judged on its merits.
It is important to recognise the efforts made by countries in the EBRD region with a view to strengthening the institutional effectiveness of their competition authorities and improving their judiciaries’ ability to deal with competition matters. Perceptions about the efficacy of public institutions in transition countries tend to be unfavourable, so when improvements are made, they need to be communicated in order to bolster public confidence.
It is also necessary to study how such improved knowledge and capacity translate into practice. Will regulators now act with greater confidence and skill, and will courts now issue better and more consistent judgments? Progress is likely to be incremental and difficult to prove. But where it is identified, one can be confident that these achievements will benefit the innovation environment. The role of competition policy in fostering innovation should not be forgotten.
In particular, the complex relationship between competition and innovation should not be allowed to cast doubt on the importance of competition policy for fostering innovation. This is especially true when thinking about innovation more broadly – not just patentable inventions, but all new approaches to doing business. It is these innovations that are increasing the private sector’s share of the region’s economy, and they need a fair and level playing field in order to thrive.
Source: EBRD.
Note: Data relate to 2013.
Source: EBRD.
Note: The SEMED region was first assessed in 2012, while Turkey was first assessed in 2009.
The EBRD carries out an annual survey looking at competition policy and its enforcement in countries where the Bank works. That survey allows a better understanding of the policy framework in which companies operate, focusing on both the legal basis (that is to say, applicable competition law) and the actual enforcement activities of national competition authorities.
From an institutional perspective, the survey focuses on the following:
From an enforcement perspective, the information collected is used to measure the quantity and quality of the resources available to the competition authority, as well as the extent and quality of the authority’s enforcement activities. In particular, the following elements are analysed:
The survey provides a clear picture of the main changes to the legislative framework, as well as describing new developments in terms of the authorities’ activities. The survey results are complemented by in-depth desktop research, with the two combining to produce a final transition score for each country’s policy regime.
Table A.5.2.1
| Composite factors | Individual factors | Description |
|---|---|---|
|
Institutions |
Institutions |
Public institutions (75% – property rights, ethics and corruption, undue influence, government efficiency, security) and private institutions (25% – corporate ethics, accountability). |
|
Macroeconomic environment |
Macroeconomic environment |
Government budget balance, gross national savings, inflation, government debt, country’s credit rating. |
|
Markets |
Goods market efficiency |
Competition (67% – domestic competition and foreign competition) and quality of demand conditions (33%) |
|
Labour market efficiency |
Efficiency (50%) and efficient use of talent (50%) |
|
|
Financial market development |
Efficiency (50%) and trustworthiness and confidence (50%) |
|
|
Market size |
Summarises information about domestic market size and foreign market size. |
|
|
Intensity of local competition* |
In your country, how intense is the competition in the local market? (1 = not intense at all; 7 = extremely intense) |
|
|
Proclivity to trade* |
Imports and exports as a percentage of GDP (hard data; simple average rescaled to 1-7) |
|
|
Prevalence of foreign ownership* |
How prevalent is foreign ownership of companies in your country? (1 = very rare; 7 = highly prevalent) |
|
|
Days to start business* |
Number of days required to start a business (hard data; rescaled to 1-7) |
|
|
Access to technology |
Availability of latest technologies |
In your country, to what extent are the latest technologies available? (1 = not available at all; 7 = extremely available) |
|
ICT availability/use |
Internet users, broadband internet subscriptions, internet bandwidth, mobile broadband subscriptions, mobile telephone subscriptions, fixed telephone lines. |
|
|
FDI and technology transfer |
To what extent does FDI bring new technology into your country? (1 = not at all; 7 = to a great extent) |
|
|
Absorptive capacity |
Secondary enrolment |
Gross secondary education enrolment rate (hard data; rescaled to 1-7) |
|
Quality of the educational system |
How well does the educational system in your country meet the needs of a competitive economy? (1 = not well at all; 7 = extremely well) |
|
|
Extent of staff training |
In your country, to what extent do companies invest in training and employee development? (1 = not at all; 7 = to a great extent) |
|
|
“Brain drain” |
Does your country attract talented people from abroad? (1 = not at all; 7 = attracts the best and brightest from around the world). Does your country retain talented people? (1 = The best and brightest leave to pursue opportunities in other countries. 7 = The best and brightest stay and pursue opportunities in this country.) |
|
|
Tertiary enrolment |
Gross tertiary education enrolment rate (hard data; rescaled to 1-7) |
|
|
Creative capacity |
“Brain drain” |
Does your country attract talented people from abroad? (1 = not at all; 7 = attracts the best and brightest from around the world). Does your country retain talented people? (1 = The best and brightest leave to pursue opportunities in other countries. 7 = The best and brightest stay and pursue opportunities in this country.) |
|
Tertiary enrolment |
Gross tertiary education enrolment rate (hard data; rescaled to 1-7) |
|
|
Availability of scientists and engineers |
In your country, to what extent are scientists and engineers available? (1 = not at all; 7 = widely available) |
|
|
Quality of scientific research institutions |
In your country, how would you assess the quality of scientific research institutions? (1 = extremely poor – among the worst in the world; 7 = extremely good – among the best in the world) |
|
|
University-industry research collaboration |
In your country, to what extent do business and universities collaborate on research and development (R&D)? (1 = do not collaborate at all; 7 = collaborate extensively) |
|
|
Intellectual property protection |
In your country, how strong is the protection of intellectual property, including anti-counterfeiting measures? (1 = extremely weak; 7 = extremely strong) |
|
|
Venture capital availability |
In your country, how easy is it for entrepreneurs with innovative but risky projects to find venture capital? (1 = extremely difficult; 7 = extremely easy) |
* These variables are also represented in the composite goods market efficiency indicator, but they are nevertheless also introduced separately to increase their weight in the markets indicator.
Source: Veugelers (2011)
D. Acemoğlu, P. Aghion and F. Zilibotti (2006)
“Distance to frontier, selection, and economic growth”, Journal of the European Economic Association, Vol. 4, No. 1, pp. 37-74.
P. Aghion, P. Askenazy, R. Bourles, G. Cette and N. Dromel (2009a)
“Education, market rigidities and growth”, Economics Letters, Vol. 102, No. 1, pp. 62-65.
P. Aghion, N. Bloom, R. Blundell, R. Griffith and P. Howitt (2005)
“Competition and Innovation: An Inverted-U Relationship”, Quarterly Journal of Economics, Vol. 120, No. 2, pp. 701-728.
P. Aghion, L. Boustan, C. Hoxby and J. Vandenbussche (2009b)
“The causal impact of education on economic growth: Evidence from U.S.”, Brookings Papers on Economic Activity, spring 2009.
P. Aghion, M. Dewatripont, L. Du, A. Harrison and P. Legros (2012)
“Industrial policy and competition”, mimeo. Available at:Industrial policy and competition
(823kb)(last accessed on 15 September 2014).
P. Aghion, S. Bechtold, L. Cassar and H. Herz (2014)
“The causal effects of competition on innovation: Experimental evidence”, mimeo. Available at:The causal effects of competition on innovation: Experimental evidence
(309kb)(last accessed on 16 September 2014).
K. Arrow (1962)
“Economic Welfare and the Allocation of Resources for Invention”, in National Bureau of Economic Research, The Rate and Direction of Inventive Activity: Economic and Social Factors, pp. 609-626.
J.B. Baker (2007)
“Beyond Schumpeter vs. Arrow: How Antitrust Fosters Innovation”, Antitrust Law Journal, Vol. 74, No. 3, pp. 575-602.
J. M. Cooper (2012)
“Science-technology policy and innovation in the USSR”, slides from the CEELBAS workshop “Russia’s Skolkovo in Comparative and Historical Perspective”, held on 12 June 2012 at the University College London School of Slavonic and East European Studies.
EBRD (2013)
Transition Report 2013: Stuck in Transition?, London.
European Commission (2013)
“Lessons from a decade of innovation policy. What can be learnt from the INNO Policy TrendChart and the Innovation Union Scoreboard”. Available at:Lessons from a Decade of Innovation policy
(1.91mb)(last accessed on 8 October 2014).
EV Consulting (2010)
“The Story of the Emerging IT Cluster in Armenia”. Available at:The Story of the Emerging IT Cluster in Armenia
(325kb)(last accessed on 17 September 2014).
EV Consulting (2014)
“National Competitiveness Report of Armenia 2013-2014: Growth Imperative and Constraints”. Available at:National Competitiveness Report of Armenia 2013-2014
(5.1mb)(last accessed on 17 September 2014).
D. Felsenstein (1994)
“University-related science parks – ‘seedbeds’ or ‘enclaves’ of innovation?”, Technovation, Vol. 14, No. 2, pp. 93-110.
D. Foray (2014)
Smart Specialisation: Opportunities and Challenges for Regional Innovation Policy, Routledge.
D. Foray, P. A. David and B. Hall (2009)
“Smart specialisation – The Concept”, Knowledge Economists Policy Brief, No. 9. Available at:Knowledge Economists Policy Brief N°9
(1.1mb)(last accessed on 18 October 2014).
D. Foray and X. Goenaga (2013)
“The goals of smart specialisation”, S3 Policy Brief Series No. 01/2013.
L. Gokhberg and A. Shadrin (2013)
“Pilot innovation territorial clusters in the Russian Federation (Pilotnye innovatsyonnye territorialnys clastery v Rossiyskoy Federatsii)”, Higher School of Economics, mimeo.
ITIDA (2013)
Impact Review 2013. Available at: www.itida.gov.eg/EN/ABOUTUS/ITIDAANNUALIMPACT2013/Pages/default.aspx (last accessed on 17 September 2014).
A.T. Kearney (2011)
“Offshoring opportunities amid economic turbulence: The A.T. Kearney Global Services Location IndexTM, 2011”, Chicago.
J. Kristapsons, H. Martinson and I. Dagyte (2003)
Baltic R&D systems in transition: Experiences and future prospects, Zinātne, Riga. Available at:
Baltic R&D Systems in Transition
(1.7mb)(last accessed on 15 September 2014).
S. Lall (1992)
“Technological capabilities and industrialisation”, World Development, Vol. 20, No. 2, pp. 165-186.
P. Lindelöf and H. Löfsten (2003)
“Science park location and new technology-based firms in Sweden – implications for strategy and performance”, Small Business Economics, Vol. 20, No. 3, pp. 245-258.
A.L. Mammadov (2013)
“ICT policy in Azerbaijan”, presentation at the First International ICT Conference and Exhibition in Afghanistan, September 2013.
R. Mazzoleni and R.R. Nelson (2007)
“Public research institutions and economic catch-up”, Research Policy, Vol. 36, No. 10, pp. 1512-1528.
N. Nunn and D. Trefler (2010)
“The structure of tariffs and long-term growth”, American Economic Journal: Macroeconomics, Vol. 2, No. 4, pp. 158-194.
OECD (2008)
OECD Reviews of Innovation Policy: Hungary, Paris.
OECD (2010)
OECD Science, Technology and Industry Outlook, Paris.
OECD (2013)
Innovation-driven growth in regions: The role of smart specialisation, preliminary version, Paris.
C. Pietrobelli (2009)
“Review of international best practices of programs to promote regional innovation systems”, Inter-American Development Bank Technical Notes No. IDB-TN-131.
W. Polt, P. Koch and A. Wolters (2007)
“Evaluation of Estonian RTDI policy mix”, Innovation Studies, No. 10.
A. Reid and J. Walendowski (2006)
“Evaluation of the Design and Implementation of Estonian RTDI Policy: Implications for Policy Planning”, Estonian Ministry of Economic Affairs and Communications.
D. Rodrik (2008)
“Normalizing industrial policy”, Commission on Growth and Development Working Paper No. 3. Available at:Normalizing Industrial Policy
(1.0mb)(last accessed on 1 September 2014).
RUSSEZ (2014)
“Innovation Zones”. Available at: http://eng.russez.ru/oez/innovation/ (last accessed on 1 September 2014).
J. Schumpeter (1942)
Capitalism, Socialism and Democracy, Harper, New York.
H. Schweiger and P. Zacchia (2014)
“Are science cities fostering firm innovation? Evidence from Russia’s regions”, mimeo.
C. Shapiro (2011)
“Competition and Innovation: Did Arrow Hit the Bull’s Eye?”, in National Bureau of Economic Research, The Rate and Direction of Inventive Activity Revisited, pp. 361-404.
Tholons (2013)
“2014 Tholons Top 100 Outsourcing Destinations: Rankings”. Available at:2014 Tholons Top 100 Outsourcing Destinations: Rankings
(261kb)(last accessed on 15 September 2014).
F. Tödtling and M. Trippl (2005)
“One size fits all? Towards a differentiated regional innovation policy approach”, Research Policy, Vol. 34, No. 8, pp. 1203-1219.
UNECE (2014)
Innovation performance review of Armenia, New York and Geneva.
B. Verspagen (1991)
“A new empirical approach to catching up or falling behind”, Structural Change and Economic Dynamics, Vol. 2, No. 2, pp. 359-380.
R. Veugelers (2011)
“Assessing the potential for knowledge-based development in the transition countries of Central and Eastern Europe, the Caucasus and Central Asia”, Society and Economy, Vol. 33, No. 3, pp. 475-501.
R. Veugelers, J. Callaert, X. Song and B. Van Looy (2012)
“The participation of universities in technology development: do creation and use coincide? An empirical investigation on the level of national innovation systems”, Economics of Innovation and New Technologies, Vol. 21, No. 5-6, pp. 445-472.
P. Westhead (1997)
“R&D ‘input’ and ‘output’ of technology-based firms located on and off science parks”, R&D Management, Vol. 27, No. 1, pp. 45-62.
World Bank (2008)
Global Economic Prospects 2008: Technology diffusion in the developing world, Washington, DC.
World Economic Forum (2013)
The Global Competitiveness Report 2013-2014, Geneva.
C.-H. Yang, K. Motohashi and J.-R. Chen (2009)
“Are new technology-based firms located on science parks really more innovative? Evidence from Taiwan”, Research Policy, Vol. 38, No. 1, pp. 77-85.