
BOX 2.1. Estimating the impact that innovation has on labour productivity
The impact that innovation has on productivity is estimated here using a well-established three-stage model which links productivity to firms’ innovation activities and, in turn, treats innovation as an outcome of firms’ investment in R&D.34 This three-stage structure (explaining: (i) the decision to engage in R&D; (ii) the decision to introduce a new product or process; and (iii) the firm’s labour productivity) is used because the management’s decisions to invest in R&D and develop/introduce innovations are likely to influence each other. In addition, these processes often take place simultaneously (see Chart 2.1.1).35
Read more
As a result, all stages are estimated simultaneously in order to address the endogeneity bias, using an asymptotic least squares (ALS) estimator and the BEEPS V and MENA ES datasets. The first stage estimates the innovation input equation:

This represents the probability of R&D investment being conducted by firm i , where R&Di takes the value of 1 whenever the latent value of R&D reported by the firm, R&Di*, is larger than zero. Xi1 is a vector of variables explaining the occurrence of R&D investment, including the firm’s size, age, direct exporter status, percentage of employees with a completed university degree, and ownership structure (whether the majority of the firm is owned by a foreign company or the state), and the percentages of working capital and fixed assets that are financed by bank loans or loans from non-bank financial institutions (NBFIs). To account for sector and country-specific differences in firm-level investment in R&D, sector and country fixed effects are included. This set of variables is assumed to influence not only R&D investment, but also productivity and innovation, as shown in Chart 2.1.1.
The second stage of the model determines the probability of a firm implementing innovation, taking into account its investment in R&D. The latent variable R&Di* which was derived from the first stage is used to explain the impact that R&D investment has on innovative activities. This solves the aforementioned problem of the endogeneity bias:

In this equation, the coefficient γ denotes the impact that R&D investment has on the probability of a firm introducing an innovation (as discussed in more detail in Chapter 3). Innovationi refers to the occurrence of the various types of innovation introduced in Chapter 1. The probability of observing such an innovation is explained by the vector Xi2 , which includes the set of variables that were introduced in the first stage, plus measures reflecting the firm’s level of geographical expansion (that is to say, whether the firm’s main product is mostly sold in the local market) and the firm’s level of ICT use (in other words, whether it uses email to communicate with its clients; see Chart 2.1.1).
The final stage of the model relates the firm’s innovative activities – explained by its investment in R&D – to labour productivity (measured as turnover per employee, converted into US dollars, in log terms), again using the latent inferred variable to explain differences across firms with regard to productivity:

In this chapter, the focus is on the coefficient ξ, which reflects the impact that innovation has on labour productivity. In addition to the set of control variables used in the first and second stages, vector Xi3 , which is used to explain variations in productivity, includes information on whether the firm is located in the country’s capital or main business centre, and whether the firm competes with unregistered or informal firms (see Chart 2.1.1).
CHART 2.1.1
The concept behind the CDM model
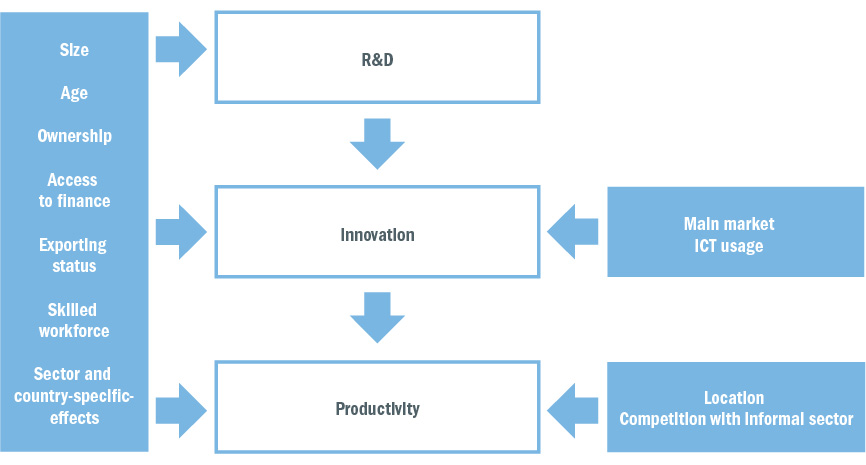
Source: Authors’ representation of the model.
Note: Based on Crépon et al. (1998).